Architecting an AIOps Strategy: Moving Beyond Static Monitoring and Thresholds

September 18, 2026 · 18 reads
Introduction
As software systems migrate toward distributed cloud environments, system telemetry expands exponentially. Pager storms, complex microservice dependencies, and fragmented logging frameworks quickly overwhelm operational teams during major outages. When response teams spend hours filtering redundant notifications, mean time to detect (MTTD) and mean time to resolve (MTTR) both degrade.
To solve this operational crisis, TheAIOps acts as a dedicated technical knowledge hub where site reliability engineers (SREs), system architects, and platform leaders can master algorithmic IT management. Deploying an effective AIOps implementation transforms unorganized telemetry into actionable operational insights.
By layering machine learning and dynamic correlation over raw system telemetry, teams can filter out operational noise, isolate root causes before end users notice degradation, and execute controlled automated responses. This guide outlines the conceptual models, architectural layers, and practical steps required to deploy Artificial Intelligence for IT Operations reliably.
Understanding the Core AIOps Concept
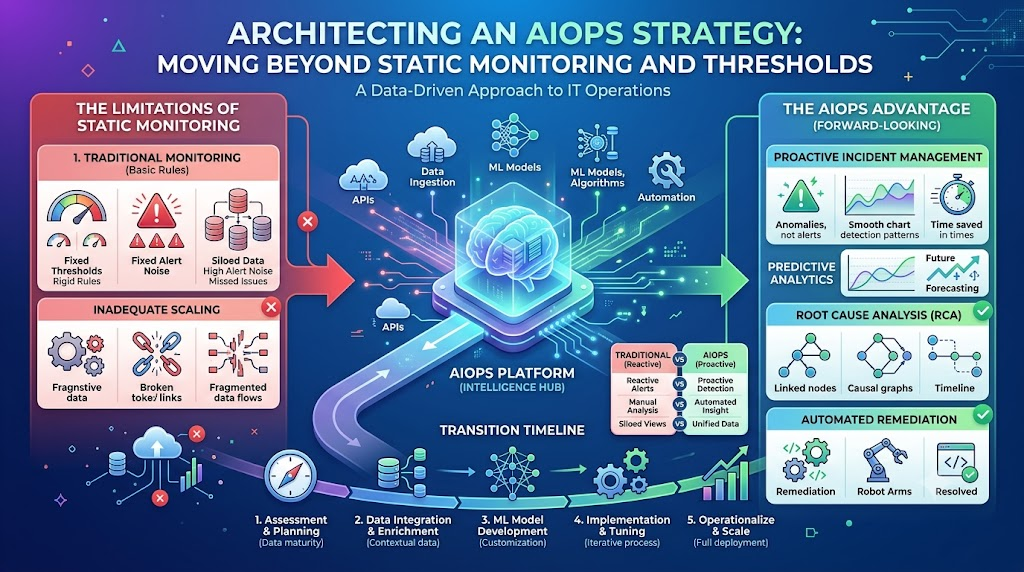
At its foundation, AIOps—short for Artificial Intelligence for IT Operations—shifts operational monitoring from reactive rule-checking to predictive contextual analysis. Traditional monitoring tools rely on hardcoded static limits (such as alerting when disk utilization reaches 90%). However, modern ephemeral environments, like auto-scaling Kubernetes clusters, make fixed limits obsolete.
+-----------------------------------------------------------------------------------+
|                                TELEMETRY INPUTS                                   |
|           Metrics    •    Logs    •    Traces    •    Topology Data               |
+-----------------------------------------------------------------------------------+
                                          │
                                          ▼
+-----------------------------------------------------------------------------------+
|                            STREAM PROCESSING & CLEANING                           |
|             OpenTelemetry Pipelines / De-duplication / Schema Normalization       |
+-----------------------------------------------------------------------------------+
                                          │
                                          ▼
+-----------------------------------------------------------------------------------+
|                            ALGORITHMIC ANALYSIS ENGINE                            |
|   Dynamic Baselines   •   Topology Correlation   •   Cluster Pattern Recognition   |
+-----------------------------------------------------------------------------------+
                                          │
                                          ▼
+-----------------------------------------------------------------------------------+
|                          ACTION & CONTROL FRAMEWORK                               |
|   Root-Cause Hypothesis   •   Contextual Routing   •   Guardrailed Remediation    |
+-----------------------------------------------------------------------------------+
Traditional Monitoring vs. AIOps
Conventional monitoring operates in isolation: an agent checks a metric against a threshold and fires an alert. In microservices architectures, a single network switch failure can trigger thousands of downstream threshold breaches.
AIOps functions as a unifying intelligence layer across existing monitoring platforms. It ingests time-series metrics, log streams, tracing data, and service topology, linking related signals into a single unified event.
Artificial Intelligence for IT Operations: Reality vs. Hype
To succeed with algorithmic operations, organizations must distinguish practical algorithmic capabilities from marketing exaggeration.
Grounded Capabilities
- Dynamic Baselining: Machine learning algorithms continuously adjust expectations for system behavior based on seasonal cycles, business hours, and traffic patterns.
- Alert Aggregation: Clustering algorithms evaluate temporal proximity, message signatures, and physical/logical topology to group thousands of notifications into one primary incident ticket.
- Pattern Analysis: Models scan historical log streams to detect recurring sequences of subtle system events that historically precede critical failures.
Operational Safeguards
Machine learning models lack intuition regarding business logic. An algorithm can spot a statistical deviation, but it cannot know whether that deviation represents a critical failure or an expected system update unless clear dependency mappings are provided.
Hypotheses produced by AI models should enrich human decision-making during high-priority incidents rather than replace engineering judgment.
Architecture of an AIOps System
A production-grade algorithmic pipeline relies on distinct operational layers to process telemetry securely:
[ Ingestion & Normalization ] ──► [ Correlation & Pattern Engine ] ──► [ Decision Analytics ]
                                                                                │
[ Operations Console / SRE ] ◄── [ ITSM & Automated Remediation ] ◄────────────┘
- Ingestion & Normalization Layer: Collects metrics, unstructured logs, and distributed traces from edge devices and applications using open, vendor-neutral protocols like OpenTelemetry.
- Correlation & Pattern Engine: Removes duplicate records, strips sensitive data, enriches events with contextual metadata, and runs real-time stream analytics.
- Decision Analytics: Runs unsupervised clustering, dynamic baseline checking, and natural language log processing to construct root-cause hypotheses.
- ITSM & Automated Remediation Layer: Pushes structured context to response platforms (e.g., PagerDuty, Jira Service Management) and executes automated runbooks under strict policy limits.
Strategic Dimensions: Tools, Platforms, Services, and Skill Development
Building an intelligent IT operations ecosystem requires balancing tool selection, strategic planning, and team training.
| Category | Primary Strategic Role | Key Functional Focus | Critical Evaluation Factor |
| AIOps Tools | Focused analytics capability | APM analytics, log pattern detection, metric baselining | API flexibility and integration limits |
| AIOps Platform | End-to-end operational engine | Data streaming, topological correlation, orchestration | Data retention costs, model transparency |
| AIOps Consulting | Architectural guidance | Telemetry audit, roadmap design, operational restructuring | Cultural readiness and technical debt |
| AIOps Services | Managed operational support | Managed observability pipelines, model tuning | Service-level agreements and safety limits |
| AIOps Training | Workforce enablement | Stream processing, OpenTelemetry, SRE workflows, Python | Practical lab work vs. surface-level theory |
Upskilling technical staff is critical to long-term success. Engineers aiming for an AIOps Engineer role must build proficiency in Linux kernel internals, distributed tracing, cloud-native storage, Python scripting, and machine learning fundamentals. Comprehensive training programs, specialized coursework, and technical guides hosted on TheAIOps provide structured learning paths for engineers mastering these domains.
While earning an AIOps Certification confirms an engineer’s understanding of core architectural patterns, practical experience debugging complex distributed systems remains the definitive measure of operational skill.
Observability: The Fuel for Algorithmic Operations
AIOps cannot function without robust underlying observability. Feeding low-quality, fragmented, or noisy data into machine learning models yields unpredictable results.
       ┌──────────────────────────────────────────────┐
       │             OBSERVABILITY STACK              │
       │   (Raw Inputs: Metrics, Logs, Traces, Topology) │
       └──────────────────────┬───────────────────────┘
                              │
                              ▼
       ┌──────────────────────────────────────────────┐
       │              AIOPS ANALYTICS                 │
       │  (Processing: Baselining, Event Correlation) │
       └──────────────────────┬───────────────────────┘
                              │
                              ▼
       ┌──────────────────────────────────────────────┐
       │             AUTOMATION & CONTROL             │
       │    (Outputs: Self-Healing, Runbook Execution)│
       └──────────────────────┬───────────────────────┘
- Metrics: Numeric time-series values that track resource consumption, enabling proactive capacity modeling.
- Logs: Timestamped application text streams that provide explicit detail for anomaly investigation via natural language processing.
- Traces: Transaction paths traversing microservices, showing latency bottlenecks and structural dependencies.
- Topology: Real-time visual and programmatic dependency graphs, ensuring correlation algorithms account for upstream and downstream service relationships.
Anomaly Detection, Event Correlation, and Root-Cause Analysis
Anomaly Detection
Traditional thresholding often generates false alerts during predictable traffic spikes. Algorithmic baselining establishes dynamic operating boundaries. For instance, high CPU usage during a scheduled daily batch job is recognized as expected behavior, whereas the same CPU surge occurring during low-traffic hours triggers an anomaly alert.
Event Correlation
When a core infrastructure failure cascades across microservices, correlation engines consolidate disparate alerts into a single actionable incident record by evaluating:
- Time Alignment: Identifying alerts triggered within the same precise time frame.
- Topological Relationships: Mapping component dependencies across the infrastructure stack.
- Log Message Clustering: Identifying shared error signatures across application log streams.
Root-Cause Isolation
Root-cause analysis engines compare incident timelines against operational change logs—such as code releases, feature-flag toggles, or infrastructure modifications—helping engineers pin point the precise commit or change that triggered the issue.
Predictive Operations and Safe Remediation
Predictive Operations
By analyzing historic system trends, predictive models highlight potential operational bottlenecks before they cause downtime, including:
- Storage Exhaustion Trends: Forecasting when database volumes will fill up based on variable growth rates.
- Hardware Degradation Signals: Catching early signs of failing storage devices or memory leaks before system crashes occur.
Automated Remediation
Automated runbooks execute self-healing steps for predictable failure modes. Safe automation relies on clear operational guardrails:
[ Incident Triggered ] ──► [ Evaluate Policy & Safety Rules ] ──► [ Execute Approved Script ] ──► [ Generate Audit Log ]
                                    │
                                    ▼ (Policy Violation)
                       [ Route to On-Call Engineer ]
- Limit initial automated steps to safe, deterministic tasks (e.g., clearing transient caches, cycling crashed worker pods, or adjusting auto-scaling groups).
- Require engineer validation for actions involving stateful infrastructure or database migrations.
- Enforce strict execution limits, rate caps, and rollback procedures to prevent runbooks from causing secondary outages.
How AIOps Intersects with Operational Frameworks
| Operational Framework | Primary Domain | Core Deliverable | Strategic AIOps Integration |
| Traditional IT Operations | Physical & cloud infrastructure | System stability, manual ticket triage | Modernized via automated noise reduction |
| DevOps | Continuous delivery pipelines | Accelerated code deployment | Automated health feedback loops in pipelines |
| Site Reliability Engineering (SRE) | Service availability & performance | Error budget management, toil reduction | Operational toil reduction through correlation |
| Observability | Internal system visibility | Structured metrics, logs, and traces | Provides the telemetry input for AI analysis |
| AIOps | Algorithmic telemetry analysis | Event aggregation, root-cause isolation | Transforms raw observability into automated action |
Realistic Production Scenarios
Scenario 1: Taming Notification Storms During Network Failures
- Problem: A core spine switch drops packets, causing hundreds of downstream microservices to throw connection timeout errors simultaneously. On-call engineers are inundated with over 800 discrete alerts within three minutes.
- AIOps Solution: The correlation engine analyzes system topology, recognizes that all failing services communicate through the degraded switch, and merges the 800 alerts into a single incident titled “Upstream Packet Loss on Spine-Switch-02.”
- Outcome: Engineers focus immediately on replacing the faulty network module rather than triaging hundreds of secondary service alerts.
Scenario 2: Catching Memory Leaks Before Service Outages
- Problem: A minor memory leak introduced in a service deployment causes application pods to crash sequentially under sustained traffic.
- AIOps Solution: Anomaly detection identifies steady, abnormal memory consumption trends hours before out-of-memory limits are breached. The system links the trend to a specific release commit.
- Outcome: The engine alerts the responsible engineering team and gracefully restarts application instances on a rolling schedule, keeping the application online while developers push a permanent fix.
Step-by-Step AIOps Implementation Framework
Executing an AIOps implementation plan requires a phased strategy focused on data quality, process integration, and safety.
┌─────────────────────────────────────────────────────────────────┐
│ Phase 1: Assessment & Strategy                                  │
│   Step 1: Audit Infrastructure & Map Telemetry Streams          │
│   Step 2: Identify High-Toil Pain Points & Set Benchmarks       │
└────────────────────────────────┬────────────────────────────────┘
                                 │
                                 ▼
┌─────────────────────────────────────────────────────────────────┐
│ Phase 2: Telemetry Standardization                              │
│   Step 3: Unify Ingestion via OpenTelemetry Standards           │
│   Step 4: Build Accurate Topology & Service Dependency Maps     │
└────────────────────────────────┬────────────────────────────────┘
                                 │
                                 ▼
┌─────────────────────────────────────────────────────────────────┐
│ Phase 3: Analytics & Signal Reduction                           │
│   Step 5: Train Dynamic Baselines for Anomaly Detection         │
│   Step 6: Deploy Event Correlation to Suppress Duplicate Alerts │
└────────────────────────────────┬────────────────────────────────┘
                                 │
                                 ▼
┌─────────────────────────────────────────────────────────────────┐
│ Phase 4: Workflow Integration & Automation                      │
│   Step 7: Connect Analytics Engines to ITSM & On-Call Tools    │
│   Step 8: Deploy Guardrailed Automated Remediation Scripts       │
│   Step 9: Establish Feedback Loops for Continuous Model Tuning   │
│   Step 10: Continuously Refine Rules and Expand Coverage        │
└─────────────────────────────────────────────────────────────────┘
Step 1: Audit the Telemetry Environment
Catalog all active monitoring agents, log aggregators, and tracing tools. Map telemetry paths to eliminate blind spots and consolidate redundant logging framework instrumentation.
Step 2: Pinpoint Pain Points and Establish Key Benchmarks
Identify high-toil operational burdens, such as excessive alert noise or lengthy root-cause investigation times. Define clear performance indicators (e.g., alert volume reduction, mean time to detect, mean time to resolve) to measure progress against.
Step 3: Standardize Telemetry Ingestion
Normalize metrics, log formats, and trace headers across all application services. Standardize on vendor-neutral collection frameworks like OpenTelemetry to ensure consistent data streams.
Step 4: Map Service Dependencies and Topologies
Construct real-time dependency topology maps across applications, container pods, and cloud infrastructure. Accurate dependency maps are essential for correlation engines to evaluate upstream and downstream impact.
Step 5: Establish Dynamic Behavioral Baselines
Enable machine learning baselining for core operational metrics. Allow models to collect data over several weeks to account for daily, weekly, and seasonal traffic cycles before activating automated alerting.
Step 6: Deploy Correlation and Aggregation Rules
Configure aggregation engines to group related events using temporal proximity, component topology, and log text signatures. Focus initial efforts on high-volume alerts to generate immediate noise reduction.
Step 7: Integrate Incident Management Platforms
Connect the correlation layer directly to incident response tools (e.g., PagerDuty, Jira, Slack). Ensure generated incident tickets contain relevant metric graphs, log snippets, and topology details.
Step 8: Introduce Guardrailed Automated Runbooks
Identify routine manual recovery tasks. Implement automated remediation scripts for low-risk actions (e.g., clearing temporary storage or cycling unhealthy instances), ensuring strict execution guardrails are enforced.
Step 9: Enforce Human-in-the-Loop Feedback Systems
Establish mechanisms for engineers to rate model recommendations during incident post-mortems. Use feedback from false positives and misdiagnosed incidents to continuously tune model parameters.
Step 10: Scale Across the Platform Iteratively
Expand implementation across additional service domains, application tiers, and business units. Regularly evaluate performance indicators to verify that operational toil decreases as coverage expands.
Governance, Data Security, and Operational Control
Applying machine learning to infrastructure management requires careful governance and security controls:
- Telemetry Scrubbing and PII Redaction: Production logs frequently contain sensitive customer details, IP addresses, or security tokens. Implement client-side sanitization pipelines to strip sensitive data before streaming telemetry to external analytics engines.
- Role-Based Access Control (RBAC): Restrict access to correlation platforms and remediation configurations. Ensure only authorized platform engineers can modify automated runbooks or safety parameters.
- Auditability and Action Lineage: Retain immutable logs for every automated action taken by remediation systems. Engineers must be able to audit why an automation script executed, what event triggered it, and what systems were modified.
- Blast-Radius Boundaries: Enforce strict execution limits on automation. For example, automated scripts must be restricted from restarting more than a small percentage of cluster nodes simultaneously.
Implementation Challenges and Pitfalls to Avoid
               [ FLAWED APPROACH ]                            [ PRAGMATIC APPROACH ]
           ┌───────────────────────────────┐              ┌───────────────────────────────┐
           │ Layer AI over chaotic processes│             │ Clean telemetry pipelines first│
           └──────────────┬────────────────┘              └──────────────┬────────────────┘
                          │                                              │
                          ▼                                              ▼
           ┌───────────────────────────────┐              ┌───────────────────────────────┐
           │ Un-guardrailed automation     │              │ Enforce safety boundaries     │
           └──────────────┬────────────────┘              └──────────────┬────────────────┘
                          │                                              │
                          ▼                                              ▼
           ┌───────────────────────────────┐              ┌───────────────────────────────┐
           │ Unpredictable, risky execution│              │ Stable, predictable operations│
           └───────────────────────────────┘              └───────────────────────────────┘
Challenges
- Data Silos: Independent engineering teams using disconnected monitoring tools prevent holistic correlation.
- Outdated Topology Maps: Missing or inaccurate dependency data severely reduces root-cause accuracy.
- Technical Skill Gaps: Teams may lack experience in data pipeline engineering, scripting, and model tuning.
Pitfalls to Avoid
- Automating Immature Processes: Applying automation to broken or undocumented operational processes accelerates systemic failure.
- Deploying Automation Without Guardrails: Granting automated runbooks unrestricted system access risks causing wide-scale production outages.
- Ignoring False Positives: Neglecting to refine models that yield false alerts erodes team trust in the platform.
- Bypassing Human Validation: Treating algorithmic recommendations as absolute truth without engineering review leads to misdiagnosed incidents.
Decision-Making Framework
Use this structured framework when selecting tools, designing architectures, or evaluating platform vendors:
[ Step 1: Identify Need ] ──► [ Step 2: Audit Telemetry ] ──► [ Step 3: Define Metrics ]
                                                                      │
[ Step 6: Validate & Test ] ◄── [ Step 5: Verify Security ] ◄─── [ Step 4: Review APIs ]
- Problem Scoping: Is the immediate goal alert suppression, automated triage, capacity planning, or runbook execution?
- Data Pipeline Verification: Does the underlying infrastructure emit clean, structured telemetry using open standards like OpenTelemetry?
- Integration Capabilities: Does the platform connect natively with existing ITSM platforms, alerting engines, and cloud APIs?
- Model Transparency: Does the tool provide explainable, auditable recommendations rather than opaque black-box outputs?
- Security and Governance: Can granular permissions, safety guardrails, and audit trails be enforced across automated workflows?
- Cost and Scalability: Can the architecture handle peak data volumes without triggering unmanageable ingestion and storage costs?
Emerging Horizons in Intelligent Operations
Algorithmic operations continues to evolve across key domain areas:
- Generative Operational Interfaces: Natural language interfaces allow SREs to query complex telemetry stacks intuitively (e.g., “Summarize all database errors following this morning’s release”).
- Automated Runbook Generation: Generative tools evaluate past incident post-mortems and chat histories to draft proposed remediation scripts for engineering review.
- Integration with Platform Engineering: Internal Developer Platforms (IDPs) embed operational intelligence directly into developer workflows, offering instant health feedback without requiring manual monitoring configuration.
- Closed-Loop Self-Healing Infrastructure: Fully autonomous remediation is maturing within tightly constrained, well-understood operational boundaries.
8 Key Takeaways
- AIOps Complements Observability: AIOps relies on comprehensive metrics, logs, and traces to extract contextual operational intelligence.
- Data Quality Dictates Outcome Quality: Accurate correlation and root-cause isolation depend on standardized telemetry formats and updated dependency maps.
- Focus Initial Efforts on Noise Reduction: Prioritize suppressing redundant notifications and grouping alerts before implementing complex predictive modeling.
- Maintain Engineering Oversight: Algorithmic recommendations should empower human decision-making. High-impact remediation must require explicit engineering confirmation.
- Enforce Safety Boundaries: Secure all automated workflows using strict execution limits, rate caps, timeouts, and detailed audit trails.
- Standardize on Open Telemetry Standards: Adopt vendor-neutral collection frameworks like OpenTelemetry to protect against ecosystem lock-in and simplify data ingestion pipelines.
- Refine Operational Culture First: Technology cannot fix fragmented operational processes. Align SRE and DevOps teams around shared SLOs and clear response policies.
- Leverage Specialized Education: Learning platforms like TheAIOps provide vendor-neutral guides and training to help teams build mastery in modern IT automation and intelligent monitoring.
Frequently Asked Questions (FAQs)
1. What is AIOps?
AIOps (Artificial Intelligence for IT Operations) combines machine learning, stream processing, and operational data analytics to help IT operations, SRE, and DevOps teams filter alert noise, detect system anomalies, correlate related events, and streamline incident response.
2. How does AIOps differ from traditional IT monitoring?
Traditional monitoring relies on fixed, static thresholds that trigger alerts when specific metrics pass hardcoded limits. AIOps continuously calculates dynamic operational baselines, analyzing context, seasonality, and complex service dependencies across distributed systems.
3. What is the relationship between observability and AIOps?
Observability provides the raw telemetry layer—metrics, unstructured logs, traces, and service topologies. AIOps ingests this raw data, using machine learning to surface actionable insights, correlate related events, and automate incident workflows.
4. Can AIOps eliminate the need for human operators?
No. AIOps automates repetitive operational tasks—such as alert deduplication, incident routing, and low-risk remediation runbooks—allowing human engineers to focus on complex troubleshooting, architecture design, and strategic reliability improvements.
5. What are the key building blocks of an AIOps platform?
An enterprise platform includes data ingestion pipelines, dynamic anomaly detection engines, topological event correlation modules, root-cause isolation tools, ITSM integrations, and secure automated runbook execution frameworks.
6. What skills are required for an AIOps Engineer?
An AIOps Engineer needs expertise across Linux system internals, cloud infrastructure, distributed tracing, network fundamentals, Python scripting, data streaming pipelines, and foundational machine learning concepts.
7. How does event correlation resolve alert fatigue?
Event correlation analyzes incoming telemetry in real time, grouping hundreds of secondary alerts triggered by a single root failure into a single structured incident ticket. This prevents on-call engineers from being flooded with duplicate notifications.
8. What is the recommended starting point for an AIOps implementation?
Begin by auditing existing telemetry pipelines and defining clear performance targets, such as reducing alert volume or lowering MTTR. Standardize log formats and dependency maps before deploying advanced machine learning models.
9. How can teams ensure automated remediation remains safe?
Safe automation requires enforcing strict policy limits, such as rate caps, step timeouts, restricted permissions, automatic rollback triggers, and complete audit logging for every automated execution in production.
10. Where can engineers learn practical AIOps skills?
Engineers can develop proficiency by studying open standards like OpenTelemetry, learning stream processing concepts, practicing runbook automation, and exploring structured educational resources available on dedicated knowledge platforms like TheAIOps.
Conclusion
Successfully executing an AIOps implementation is an evolutionary journey that blends telemetry standardization, pragmatic engineering, operational governance, and intelligent automation. Far from being a quick fix, algorithmic operations serves as an analytical engine that cuts through system complexity, eliminates operational toil, and dramatically accelerates incident triage.By prioritizing telemetry quality, enforcing strict safety limits around automated runbooks, and keeping human expertise at the center of decision-making, organizations can construct resilient IT systems capable of scaling alongside modern cloud architectures. Specialized educational resources, practical architectural frameworks, and community insights hosted on TheAIOps equip engineers and technical leaders with the skills needed to navigate this operational transformation confidently.
Leave a Reply