Data Pipeline Automation: Modern Frameworks & Practical Architecture

September 17, 2026 · 4 reads
Introduction
Data engineering platforms frequently struggle under the weight of fragile, loosely coupled infrastructure. As organizations scale, relying on ad-hoc scripts, basic time-based schedulers, or manual operational interventions creates severe operational debt. Unannounced schema alterations, undetected pipeline halts, silent data corruption, and stale reporting dashboards quickly strip business teams of their confidence in analytical outputs.
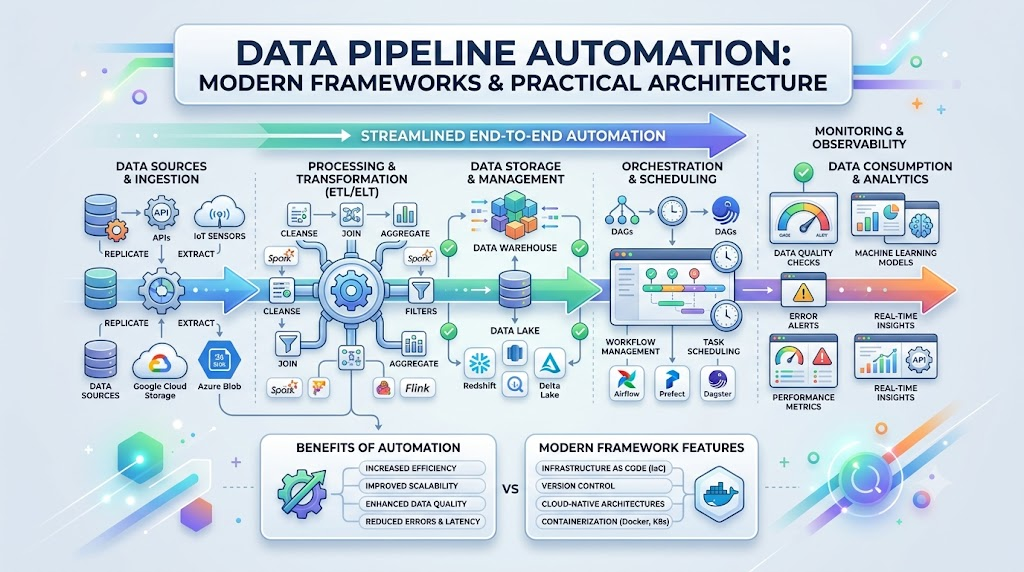
Systemic automation decouples operational reliability from manual oversight. By adapting core software engineering paradigms—including distributed version control, continuous integration and delivery (CI/CD), declarative infrastructure, automated quality assertions, and telemetry-driven observability—data teams transform fragile processing chains into self-healing platforms. Instead of spending cycles reacting to downstream breakages, engineers can construct workflows that intercept errors at the boundary, validate data in motion, and automatically adapt to execution demands.
This guide details the architectural blueprints, technical practices, ecosystem choices, and operational models required to automate data workflows effectively. Whether you are refactoring legacy batch processing or designing a cloud-native platform, this blueprint provides a path toward predictable data delivery aligned with modern DataOps principles. Explore further educational guides and operational frameworks at TheDataOps.org.
Understanding Automated Data Pipelines
Automation in data engineering is the continuous management of data ingestion, schema validation, transformation logic, and delivery through programmatic control planes. Rather than treating pipelines as fixed, scheduled scripts, modern automated systems treat them as event-aware software products capable of validating their internal state, handling transient operational faults, and emitting rich operational telemetry.
+-----------------------------------------------------------------------------------+
|                        AUTOMATED DATA WORKFLOW ARCHITECTURE                       |
+-------------------+-------------------+-------------------+-----------------------+
|  1. ADAPTIVE      |  2. PROGRAMMATIC  |  3. DECLARATIVE   |  4. TELEMETRY &       |
|     INGESTION     |     ASSERTIONS    |     EXECUTION     |     REMEDIATION       |
|                   |                   |                   |                       |
| Event Streaming   | Pre-load Specs    | DAG Compilation   | SLA Tracking          |
| CDC Log Tailing   | Schema Contracts  | Dynamic Retries   | Automated Quarantine  |
| API Webhooks      | In-Line Checks    | Isolated Compute  | Lineage Graphing      |
+-------------------+-------------------+-------------------+-----------------------+
An automated pipeline platform operates across four continuous operational domains:
- Adaptive Ingestion: Capturing upstream events via streaming change data capture (CDC), webhooks, or dynamic polling mechanisms that adjust to source availability.
- Programmatic Assertions: Enforcing schema contracts, evaluating record-level constraints, and quarantining malformed payloads before bad records propagate downstream.
- Declarative Execution: Compiling task dependencies dynamically, allocating runtime compute environments on demand, and managing execution states safely across retries.
- Telemetry and Remediation: Capturing system metrics, evaluating data freshness, generating alert payloads, and automatically triggering fallback routes or circuit breakers during outages.
Engineers who implement these controls reduce maintenance overhead and create platform ecosystems capable of self-correcting during minor upstream disruptions.
DataOps as the Operational Engine
DataOps applies the principles of DevOps and Agile software delivery to data platform operations. While traditional data management treats build cycles and production support as separate disciplines, DataOps unifies them through continuous execution layers.
       [ Integrated Platform Architecture ]

     Engineering Best Practices    Data Platform Engineering
     (Git, Declarative IaC, CI)    (Processing, Analytics, Modeling)
               \                        /
                \                      /
                 v                    v
           +--------------------------------+
           | AUTOMATED OPERATIONAL ENGINE   |
           +--------------------------------+
                        |
                        v
           +--------------------------------+
           | - Automated Pre-flight Audits  |
           | - Ephemeral Test Environments  |
           | - Declarative Deployment Rules |
           | - Real-time Quality Gateways   |
           +--------------------------------+
Without rigorous pipeline automation, DataOps strategies remain purely theoretical. Key engineering foundations bridging these paradigms include:
- Declarative Codebases and Configurations: Pipeline definitions, orchestrator DAGs, transformation models, and infrastructure manifests live entirely within Git repositories. All modifications require peer review, static code analysis, and automated execution testing prior to deployment.
- Continuous Integration & Delivery Pipelines: Release workflows deploy code changes across staging environments automatically, running unit tests, dry-run query compilations, and integration suites before pushing updates to production targets.
- Continuous Feedback and Telemetry: System metrics, compute utilization, and data assertion failures feed directly into centralized operational monitoring systems, enabling rapid root-cause isolation.
This operational framework gives data teams the confidence to deploy frequent platform updates without breaking production pipelines.
Cross-Disciplinary Operational Boundaries
Understanding the operational boundaries between related disciplines helps clarify team responsibilities and technical ownership across the data engineering ecosystem.
| Discipline | Core Responsibility | Primary Operational Scope | Primary Success Metrics |
| DataOps | Platform reliability and pipeline automation | Continuous testing, deployment automation, quality gates, operational monitoring | Pipeline availability, data freshness SLAs, time-to-detect (TTD) defects |
| Data Engineering | Architecture and transformation logic | Extract-load-transform (ELT) development, data warehousing, processing algorithms | Compute efficiency, execution velocity, storage layout optimization |
| DevOps | Infrastructure delivery and system reliability | Infrastructure-as-Code (IaC), host provisioning, container routing, CI/CD orchestration | Deployment frequency, change fail rate, mean time to recovery (MTTR) |
| MLOps | Model operationalization and lifecycle tracking | Feature store maintenance, training orchestration, drift monitoring, model serving | Prediction latency, feature freshness, inference drift metrics |
| Platform Engineering | Internal developer platform self-service | Cloud account management, identity controls, base container images, access portals | Developer onboarding velocity, platform adoption rate, API stability |
Architectural Layers of an Automated Data Platform
A resilient automated data platform relies on loosely coupled, highly integrated functional components designed to prevent single points of failure.
+-----------------------------------------------------------------------------------+
|                        MODERN AUTOMATED DATA SYSTEM STACK                         |
+-----------------------------------------------------------------------------------+
|  SOURCE LAYER        Operational DBs | Webhooks | Distributed Logs | S3/GCS Assets |
+-----------------------------------------------------------------------------------+
                                         |
                                         v
+-----------------------------------------------------------------------------------+
|  INGESTION LAYER     CDC Streams / API Connectors / Message Queues                |
+-----------------------------------------------------------------------------------+
                                         |
                                         v
+-----------------------------------------------------------------------------------+
|  CONTROL PLANE       Event-Driven Orchestrators / Task Schedulers                 |
+-----------------------------------------------------------------------------------+
                                         |
                                         v
+-----------------------------------------------------------------------------------+
|  PROCESSING LAYER    Modular SQL Enforcers / Distributed Compute Engines          |
+-----------------------------------------------------------------------------------+
                                         |
                                         v
+-----------------------------------------------------------------------------------+
|  RELIABILITY LAYER   Assertion Engines / Anomaly Detectors / Lineage Indexers     |
+-----------------------------------------------------------------------------------+
                                         |
                                         v
+-----------------------------------------------------------------------------------+
|  CONSUMPTION LAYER   Analytical Warehouses / BI Interfaces / Reverse ETL Pipelines |
+-----------------------------------------------------------------------------------+
1. Ingestion Control Layer
Manages connectivity to external source platforms. Modern ingestion systems automatically handle API rate-limit throttling, exponential backoff retries, schema drift detection, and log-based change data capture (CDC).
2. Workflow Orchestration Engine
Serves as the execution coordinator for the platform. Schedulers construct dynamic dependency graphs, handle concurrent job allocations, run isolated task environments, and track dependency states across processing stages.
3. Processing and Transformation Core
Transforms raw staging payloads into structured analytical models. Modern frameworks decouple transformation logic from underlying compute engines, using compiled, version-controlled SQL or Python scripts executed on cloud warehouses or distributed clusters.
4. Automated Assertion and Validation Gateway
Evaluates incoming data against structural and statistical specifications before promoting records to downstream analytics layers. This layer intercepts malformed data payloads, prevents broken joins, and enforces structural integrity constraints.
5. Telemetry and Observability Suite
Monitors system operations by tracking metadata across five critical vectors: arrival freshness, volume variations, structural schema drift, end-to-end data lineage, and custom quality metrics.
Tooling Frameworks for Automated Workflows
Building an automated data stack requires selecting tools that integrate seamlessly across functional layers while fitting the team’s operational capabilities.
+----------------------------------------------------------------------------------+
|                      AUTOMATION TOOLING CATEGORIZATION MATRIX                    |
+------------------------+------------------------+--------------------------------+
| CATEGORY               | OPEN ENGINE / CORE     | MANAGED PLATFORM               |
+------------------------+------------------------+--------------------------------+
| Orchestration          | Apache Airflow         | Astronomer                     |
|                        | Dagster, Prefect       | Dagster Cloud, Prefect Cloud   |
+------------------------+------------------------+--------------------------------+
| Ingestion & Streaming  | Airbyte Open Source    | Fivetran                       |
|                        | Debezium, Apache Kafka | Confluent Cloud                |
+------------------------+------------------------+--------------------------------+
| Transformation         | dbt Core               | dbt Cloud                      |
|                        | Apache Spark           | Databricks                     |
+------------------------+------------------------+--------------------------------+
| Quality & Telemetry    | Great Expectations     | Monte Carlo                    |
|                        | Soda Core              | Datadog, Acceldata             |
+------------------------+------------------------+--------------------------------+
Workflow Orchestrators
- Apache Airflow: An established, highly scalable Python-based framework that allows teams to construct complex workflows as Directed Acyclic Graphs (DAGs). Its ecosystem features extensive cloud and service integrations.
- Dagster: An asset-focused orchestration engine designed around data dependencies rather than simple task sequences. It offers native support for local execution, software-defined assets, and structured data testing.
- Prefect: A developer-centric workflow engine that turns standard Python functions into dynamic, event-driven execution pipelines with native async execution support.
Transformation Engines
- dbt (data build tool): A software engineering framework for data transformation that brings modular SQL execution, automatic dependency graph generation, Jinja templating, and automated testing directly inside data warehouses.
- Apache Spark: A unified engine for distributed, large-scale data processing that handles both batch and real-time streaming operations across scalable clusters.
Data Ingestion Infrastructure
- Airbyte & Fivetran: Ingestion solutions that standardize source extraction workflows, managing API pagination, connection pooling, and target schema mapping automatically.
- Debezium: A log-based CDC framework that converts database updates into low-latency event streams using distributed queueing platforms like Apache Kafka.
Validation & Observability Frameworks
- Great Expectations: A Python assertion engine that validates, profiles, and documents datasets using customizable rule configurations.
- Soda Core: A lightweight execution tool that runs declarative data quality audits against relational databases and data warehouses via YAML configurations.
- Monte Carlo: An enterprise data observability system that uses machine learning models to detect schema drift, freshness anomalies, and volume fluctuations across enterprise data platforms.
Dual-Layer Validation: Rules-Based Quality vs. Statistical Observability
A complete automation strategy must validate both execution integrity (did the pipeline run correctly?) and content integrity (is the data valid?). Automating execution without validating payload content only distributes corrupted data faster.
                  +-----------------------------------+
                  |   PLATFORM DATA HEALTH FRAMEWORK  |
                  +-----------------+-----------------+
                                    |
            +-----------------------+-----------------------+
            |                                               |
            v                                               v
+-----------------------+                       +-----------------------+
|  RULES-BASED QUALITY  |                       | DYNAMIC OBSERVABILITY |
|  (Deterministic)      |                       | (Statistical / ML)    |
+-----------------------+                       +-----------------------+
| - Primary Key Integrity|                      | - Schema Evolution    |
| - Null-Value Limits   |                       | - Arrival Latency     |
| - Business Constraints|                       | - Volume Deviations   |
| - Referential Audits  |                       | - Upstream Dependency |
+-----------------------+                       +-----------------------+
Deterministic Rules-Based Testing
Deterministic quality checks evaluate records against explicit operational assumptions:
- Primary Key Verification: Ensuring unique identifiers contain no null values or duplicate keys prior to join operations.
- Value Boundary Assertions: Validating that numeric fields fall within expected domain parameters (e.g., transaction amounts must be strictly positive).
- Referential Integrity Audits: Confirming that foreign keys in fact tables match corresponding dimension tables before loading down-stream datasets.
Dynamic Statistical Observability
Observability frameworks analyze platform metadata to detect subtle system anomalies that static rules might miss:
- Latency Tracking: Measuring the elapsed time between data generation at the source system and physical storage in downstream analytical tables.
- Volume Variance Profiling: Flagging unannounced swings in row counts caused by upstream application bugs or API pipeline disruptions.
- Schema Evolution Audits: Detecting altered column definitions, removed fields, or unexpected data type changes before they break analytical queries.
- Lineage Tracking: Graphing dependencies upstream and downstream to identify root causes during incidents and assess impact before running updates.
Real-World Engineering Patterns
Scenario 1: Event-Driven File Ingestion with Isolated Quarantine Routing
In this pattern, an enterprise platform ingests high-volume third-party logistics data deposited into cloud storage buckets. Rather than running a fixed schedule that might check empty directories or process incomplete files, the pipeline uses event-driven validation loops.
[ Object Creation Event ] ---> [ Serverless Router ] ---> [ In-Line Validation Engine ]
                                                                   |
                                              +--------------------+--------------------+
                                              |                                         |
                                        (Valid Payload)                         (Invalid Payload)
                                              |                                         |
                                              v                                         v
                                    [ Trigger Processing DAG ]               [ Move to Quarantine ]
                                                                             [ Fire Incident Alert ]
The automated process works as follows:
- Trigger Phase: A third-party vendor uploads a CSV payload into an Amazon S3 storage bucket, firing a native object creation notification to an event router.
- Validation Stage: An isolated serverless function running a light Python validation layer reads the file, checking header schemas against a defined specification and auditing record fields for null constraints using
Soda Core. - Branching Decision:
- Validation Success: The file routes to an active storage zone, and an API call triggers an Apache Airflow DAG to load data into Snowflake and execute transformation models.
- Validation Failure: The system redirects the file to an isolated quarantine bucket, logs an error event, and fires an incident alert to a Slack channel containing detailed error traces.
Scenario 2: Automated Testing and Deployment Pipeline for Transformation Code
Manual deployments of data transformation logic often introduce syntax errors, broken table relationships, or unoptimized queries into production databases.
[ PR Submitted (Git) ] ---> [ CI Workflow Triggered ] ---> [ Ephemeral Sandbox Build ]
                                                                      |
                                                    +-----------------+-----------------+
                                                    |                                   |
                                              (Checks Pass)                       (Checks Fail)
                                                    |                                   |
                                                    v                                   v
                                          [ Merge to Main Branch ]            [ Block PR & Notify ]
                                          [ Deploy Production dbt ]
An automated deployment pipeline built with GitHub Actions and dbt Core operates as follows:
- Trigger: A analytics engineer alters a SQL data transformation model and opens a Pull Request (PR) targeting the
mainbranch. - Automated CI Validation: A GitHub Actions runner executes a series of test steps:
- Code Quality Audits: Executes
SQLFluffto enforce team code styling rules. - Compilation Check: Runs
dbt compileto ensure query syntax validity. - Sandboxed Integration Tests: Spins up an isolated ephemeral schema in BigQuery, compiles modified SQL models, and runs
dbt testto verify primary key uniqueness and non-null constraints against sample datasets.
- Code Quality Audits: Executes
- Production Deployment: Once the CI pipeline completes successfully and an engineer approves the PR, merging code into
mainautomatically triggers production deployment jobs, updates generated documentation sites, and updates data catalog references.
Step-by-Step Implementation Framework
Transitioning to an automated data platform works best through an iterative execution model that delivers measurable stability improvements at each phase.
+-----------------------------------------------------------------------------------+
|                     DATA PIPELINE AUTOMATION IMPLEMENTATION ROADMAP               |
+-----------------------------------------------------------------------------------+
|  PHASE 1: AUDIT & MAP       Catalog existing pipelines, cron jobs, and failure modes|
|  PHASE 2: VERSION CONTROL   Consolidate models, DAGs, and configs into Git repo   |
|  PHASE 3: ORCHESTRATION     Deploy central orchestrator to manage state & retries |
|  PHASE 4: QUALITY GATES     Implement in-line quality assertions on critical paths|
|  PHASE 5: CI/CD PIPELINES   Automate static analysis, sandbox builds, and deploys |
|  PHASE 6: OBSERVABILITY     Add continuous metadata tracking, alerts, and lineage |
|  PHASE 7: OPTIMIZATION      Review performance metrics, optimize compute costs    |
+-----------------------------------------------------------------------------------+
Step 1: Audit Platform Assets and Failure Modes
Catalog all active data workflows, scheduled jobs, custom integration scripts, and manual processing tasks. Document execution frequencies, failure rates, compute costs, and downstream dependencies to identify critical points of failure.
Step 2: Establish Centralized Version Control
Migrate all pipeline logic, transformation models, orchestration scripts, and infrastructure manifests into a consolidated Git repository. Enforce code review standards and structured branching policies across the team.
Step 3: Implement Centralized Workflow Orchestration
Deploy a dedicated orchestration engine (e.g., Apache Airflow, Dagster, Prefect) to manage execution schedules, task dependencies, retries, and operational logging centrally, replacing isolated cron tasks.
Step 4: Integrate Pre-Load Quality Gates
Incorporate testing tools into core processing flows. Focus first on high-impact analytical pipelines, adding schema checks, null validations, and key constraints to block bad data before it lands in production.
Step 5: Construct CI/CD Release Workflows
Build automated deployment pipelines using continuous integration platforms (e.g., GitHub Actions, GitLab CI). Automate linting, query compilation checks, and sandboxed deployment testing for all code changes.
Step 6: Deploy Telemetry and Observability Tools
Implement metadata monitoring to track arrival freshness, volume variances, and schema drift continuously. Route actionable alerts directly to operational communication channels with clear triage instructions.
Step 7: Measure, Review, and Optimize
Continuously measure system metrics, including pipeline uptime, data delivery SLAs, incident detection times, and infrastructure compute costs. Refine resource configurations and retry limits based on real operational data.
Common Implementation Pitfalls and Mitigations
+----------------------------------+--------------------------------------------------+
| PITFALL                          | MITIGATION STRATEGY                              |
+----------------------------------+--------------------------------------------------+
| Automating Unstable Code         | Refactor legacy SQL models and fix joins BEFORE  |
|                                  | writing automation and deployment rules.         |
+----------------------------------+--------------------------------------------------+
| Alert Fatigue                    | Set strict threshold limits; route breaking      |
|                                  | issues to pages and non-critical logs to digests.|
+----------------------------------+--------------------------------------------------+
| Monolithic Orchestration Graphs  | Break large DAGs into modular, domain-driven     |
|                                  | workflows connected via event sensors.           |
+----------------------------------+--------------------------------------------------+
| Storing Static Environment State | Inject secrets at runtime using dedicated secret |
|                                  | management services (e.g., HashiCorp Vault).     |
+----------------------------------+--------------------------------------------------+
| Uncapped Resource Allocation     | Define strict execution timeouts, retry limits,  |
|                                  | and compute autoscaling bounds on worker nodes.  |
+----------------------------------+--------------------------------------------------+
Automating Unstable Pipeline Logic
Attempting to automate poorly designed or buggy transformation scripts only accelerates the delivery of bad data. Clean up ambiguous SQL joins, resolve data type conflicts, and stabilize source models before building automated release pipelines.
Alert Fatigue
Configuring notifications for minor, non-actionable schema changes or transient network blips causes engineers to ignore alerts altogether. Establish clear alert severities: high-priority incidents page on-call engineers immediately, while minor telemetry updates route to daily summary digests.
Monolithic Workflow Architectures
Designing single orchestration graphs that contain dozens of unrelated processing steps complicates debugging and increases cascade failure risks. Decouple broad workflows into smaller, domain-focused pipelines that communicate through event triggers or dataset sensors.
Hardcoding Hard Credentials and Configuration
Storing connection strings, API tokens, or host addresses directly in code repositories introduces security vulnerabilities and operational friction. Inject configuration settings and credentials dynamically at runtime using secure secrets managers.
Uncapped Compute Allocation
Unconstrained automated jobs can launch runaway queries or infinite retry loops, leading to unexpected cloud compute costs. Set clear execution timeouts, maximum retry counts, and resource limits across all processing tasks.
Technology Selection Framework
Use this structured selection process to evaluate new tools, automation platforms, or architectural changes:
[ Step 1: Define SLA Needs ] ---> [ Step 2: Inventory Skillset ] ---> [ Step 3: Evaluate Integrations ]
                                                                                  |
                                                                +-----------------+-----------------+
                                                                |                                   |
                                                          (Meets Criteria)                (Fails Criteria)
                                                                |                                   |
                                                                v                                   v
                                                     [ Step 4: Run Technical PoC ]       [ Reject Solution ]
                                                                |
                                                                v
                                                     [ Step 5: Calculate TCO & Deploy ]
- Define SLA and Latency Needs: Determine whether your business use cases require continuous real-time streaming, micro-batching, or standard daily batch runs.
- Audit Engineering Skillsets: Align tool choices with your team’s technical capabilities (e.g., Python engineering skills versus SQL-focused analytics experience).
- Evaluate Integration Capabilities:
- Extensibility: Can engineers build custom modules, connectors, or testing rules easily?
- Observability Support: Does the system expose open performance metrics, structured execution logs, and API access?
- Governance & Security: Does the platform integrate with single sign-on (SSO), role-based access control (RBAC), and secret managers?
- Conduct a Proof-of-Concept (PoC): Test prospective tools against realistic production workloads to evaluate setup friction, error handling, local development experience, and operational complexity.
- Calculate Total Cost of Ownership (TCO): Account for software licensing, cloud compute consumption, platform setup, and ongoing engineering maintenance costs before committing to a tool.
The Evolving Role of the DataOps Engineer
As automated platforms become central to modern data organizations, the demand for specialized DataOps Engineers continues to grow.
                       +---------------------------------------+
                       |           DATAOPS ENGINEER            |
                       +-------------------+-------------------+
                                           |
           +-------------------------------+-------------------------------+
           |                               |                               |
           v                               v                               v
+--------------------+           +--------------------+           +--------------------+
| SOFTWARE & DATA    |           | INFRASTRUCTURE     |           | QUALITY & CONTROL  |
+--------------------+           +--------------------+           +--------------------+
| - Python & SQL     |           | - CI/CD Automation |           | - Programmatic Testing
| - Warehouse Tuning |           | - Docker & K8s     |           | - Observability    |
| - Pipeline Design  |           | - Infrastructure-  |           | - Lineage & Policy |
|                    |           |   as-Code          |           |   Enforcement      |
+--------------------+           +--------------------+           +--------------------+
Core Competency Profile
- Software Engineering Foundations: Proficiency in Python, advanced SQL query optimization, object-oriented design, and version control workflows.
- Orchestration & Infrastructure: Deep experience with orchestration systems (Airflow, Dagster, Prefect), container platforms (Docker, Kubernetes), and Infrastructure-as-Code (Terraform).
- Data Quality & Telemetry: Hands-on mastery of data testing tools (dbt test, Great Expectations, Soda) and observability frameworks.
- CI/CD & Deployment Automation: Skill in designing deployment pipelines using GitHub Actions, GitLab CI, or Jenkins to test, package, and deploy platform updates automatically.
Skill Development Strategies
While vendor certifications (AWS Certified Data Engineer, Azure Data Engineer Associate, Astronomer Certification for Apache Airflow) provide structured learning targets, practical portfolio projects carry significant weight.
Building open-source demonstration projects—such as public Git repositories featuring infrastructure-as-code manifests, automated quality gates, dynamic Airflow DAGs, and continuous integration workflows—is an effective way to demonstrate hands-on expertise. Educational hubs like TheDataOps.org offer technical resources, guides, and practical frameworks to support ongoing career development.
Security, Compliance, and Data Governance
Automation controls must operate within secure, compliant operational boundaries:
- Role-Based Access Control (RBAC): Service accounts running automated jobs should operate under the principle of least privilege, granting write access only to designated target staging environments.
- Dynamic Secrets Injection: Database credentials, API tokens, and access keys should be injected into execution nodes dynamically at runtime using secure secrets managers rather than stored in repositories or static config files.
- Automated Data Masking: Ingestion and transformation routines should automatically mask, hash, or tokenize Personally Identifiable Information (PII) before writing records to analytical databases to support GDPR, CCPA, and HIPAA compliance.
- Immutable Operational Audit Trails: Retain comprehensive logs covering job executions, schema modifications, user interactions, and deployment events to satisfy internal risk controls and external compliance audits.
Emerging Trends in Automated Data Operations
- Data Contracts: Formal, version-controlled schema and quality specifications negotiated between source-system software developers and downstream data platform teams. Automated CI pipelines test upstream changes against active contracts to catch breaking changes before deployment.
- AI-Assisted Operational Healing: Machine learning models are moving beyond simple anomaly detection to perform root-cause analysis and automatically generate query fixes for common pipeline failures.
- Declarative Metadata Frameworks: Abstraction layers that allow engineers to define pipelines using declarative YAML/JSON configurations. Centralized engine frameworks read these specifications to compile, run, and monitor underlying execution jobs automatically.
- Self-Service Internal Platform Provisioning: Data platforms are integrating with internal developer portals, allowing analytics engineers to spin up compliant infrastructure assets and testing environments automatically using self-service templates.
Practical Takeaways
- Shift Left on Testing, Shift Right on Monitoring: Run schema and data quality assertions early in staging environments and ingestion stages, while tracking continuous telemetry across production systems.
- Manage Platform Assets as Software: Maintain orchestration DAGs, transformation logic, and infrastructure configurations within version-controlled repositories using pull request workflows.
- Decouple Functional Platform Layers: Separate ingestion, transformation, orchestration, and monitoring layers using modular tools rather than building rigid, monolithic scripts.
- Implement Continuous Metadata Observability: Go beyond simple execution monitoring by tracking data arrival freshness, volume trends, schema evolution, and end-to-end lineage.
- Design for Execution Idempotency: Ensure automated workflows produce identical target states regardless of run counts over a given processing window, simplifying backfills and automated retries.
- Limit Alerts to Actionable Events: Route non-critical operational telemetry to daily digest logs while reserving real-time alerts for actionable incidents that impact business SLAs.
Frequently Asked Questions (FAQs)
1. How does data pipeline automation differ from standard job scheduling?
Standard job scheduling simply triggers scripts at fixed time intervals regardless of system state. Data pipeline automation uses intelligent orchestrators to manage execution based on event drivers, dependency checks, automated quality tests, and system telemetry.
2. Why is execution idempotency important in automated data pipelines?
An idempotent pipeline produces identical analytical states regardless of execution frequency over a target dataset. This ensures that automated retries, error recovery steps, and historical backfills run safely without introducing duplicate records or corrupted state metrics.
3. How do data quality checks prevent silent data corruption?
Data quality checks run programmatic assertions against incoming records, verifying primary key uniqueness, null-value constraints, and expected range parameters. If a check fails, the pipeline isolates the bad data, preventing corrupted records from reaching downstream analytics.
4. Which orchestration tools are best suited for modern automated pipelines?
Popular orchestrators include Apache Airflow for large-scale, highly customizable workflows; Dagster for asset-centric modeling and native data testing; and Prefect for developer-friendly, dynamic Python execution graphs.
5. How does CI/CD improve data platform reliability?
CI/CD workflows automate code linting, query compilation, and sandboxed integration testing whenever engineers update transformation models. This prevents syntax errors, broken relationships, or bad logic from reaching production environments.
6. What core technical skills define a DataOps Engineer?
DataOps Engineers need strong skills in Python, SQL, orchestration engines (Airflow, Dagster), infrastructure-as-code (Terraform), container environments (Docker, Kubernetes), CI/CD platforms, and automated data testing frameworks.
7. How should teams begin modernizing a fragile, manual pipeline system?
Start by placing all transformation models and orchestration scripts under Git version control. Next, deploy a central workflow orchestrator, add basic quality checks to high-priority pipelines, and build simple CI pipelines to test code updates before deployment.
8. What is the difference between static data tests and dynamic data observability?
Static tests evaluate data against hardcoded rules (e.g., field X cannot be NULL). Dynamic observability uses metadata tracking and statistical models to catch unannounced changes, such as unexpected volume drops, delayed data arrivals, or schema drift.
9. How do data contracts improve pipeline stability?
Data contracts create explicit, version-controlled agreements between upstream software application developers and downstream data teams. CI build steps validate upstream updates against active contracts to catch breaking changes before they hit production.
10. Where can technical teams find educational resources for DataOps implementation?
Educational platforms like TheDataOps.org provide practical guides, architectural blueprints, tool comparisons, and learning resources focused on modern DataOps practices, data engineering, and automated platform operations.
Conclusion
Automating data pipelines is essential for scaling modern data platforms reliably. Relying on manual deployments, basic time-based schedulers, and reactive bug fixes creates operational debt, degrades analytical quality, and consumes engineering time.By integrating software engineering practices—such as version-controlled code, CI/CD deployment pipelines, modular orchestration engines, automated pre-flight testing, and dynamic metadata observability—organizations build resilient, self-healing data ecosystems. This DataOps-aligned strategy allows data teams to isolate errors early, deploy updates safely, and supply downstream business teams with consistent, high-quality data assets.
Leave a Reply